
Eursap's SAP Tips: ABAP Essentials - debugging an error message
Eursap's SAP Tips: ABAP Essentials - debugging an error message.
Sometimes it is handy to know why an error message (or a warning message) is being posted in a transaction.
To do this is pretty easy, although you will need some more advanced ABAP skills to analyse the error. However, your ABAPer will appreciate you offering up the exact place where the error is hit in order to analyse it for you.
Follow these steps to identify where the error is hit:
1. Get the message ID.
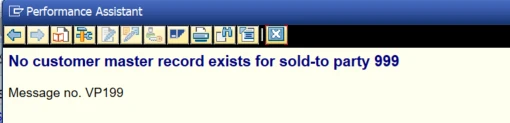
To do this, process your transaction until the error comes up. When the error is posted, double click on the message to see the technical details.
Example below – double click on the message:

The error message is number 199 in ID “VP”:
2. Switch debugging on.
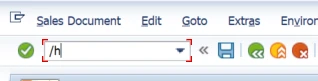
To do this, type “/h” into the transaction bar as below and then press enter:
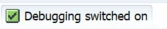
You should see the following message:
3. Trigger the error message.
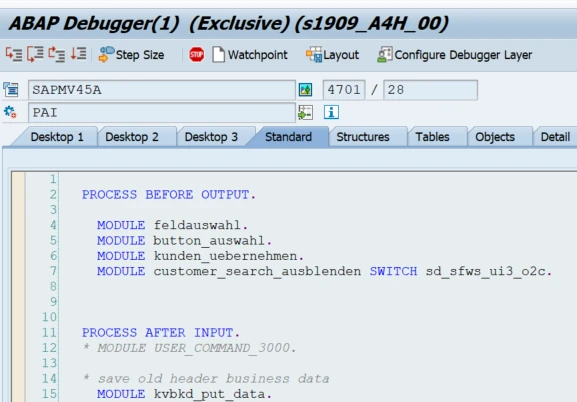
Press Enter again in the same transaction area to trigger the error message. The debugger will automatically open:
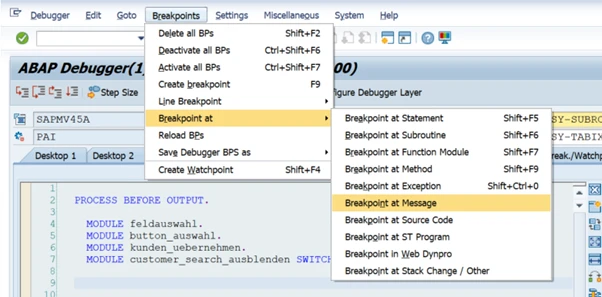
4. Stop the code at the message
To do this, from the menu, select “Breakpoints > Breakpoint at > Breakpoint at Message”, as below.
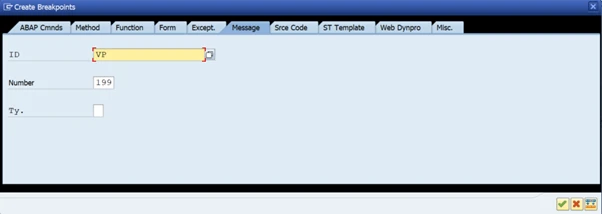
5. Select the correct message ID and number
Add you message ID and number from step 1, as below and press Enter:
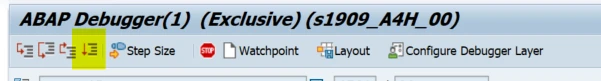
6. Continue the code flow
Press F8 or hit the “Continue” icon as below:
7. Identify the place where the error message is posted
The code has automatically stopped at where the error message has been posted, as below:
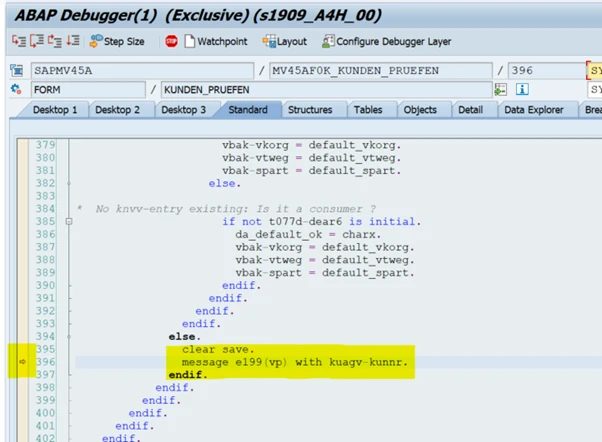
8. If you have the ABAP skills, you can now analyse the preceding code to see why the error message was hit - or alternatively, engage with your friendly ABAPer to help you!
More Blogs


