Eursap’s European SAP Salary & Rate Guide
2026/2027
Permanent SAP salaries, SAP contractor day rates and midpoints, SAP skills in demand, language premiums,
take-home and real pay, cost to employer, contract vs permanent, key SAP dates, hiring timescales and strategies.
21 EUROPEAN SAP MARKETS COVERED
European SAP recruitment market analysis by Eursap
Contents
A guide to what’s on each page - click any row to go straight to it.
- 1 The 2026/2027 SAP market at a glance A few numbers and useful things to know, and where to find the detail.
- 2 Introduction What this guide covers, who it is for, and how to use it.
- 3 What SAP professionals value most from jobs in 2026/2027 Nine factors that decide whether SAP candidates engage and accept offers.
- 4 SAP skills in demand in 2026/2027 The nine skill areas rated for demand, scarcity and rate premium, with Eursap’s view.
- 5 Key SAP dates 2026–2033 Maintenance deadlines, cloud milestones and the AI roadmap - and what each one means for SAP skills demand and pay.
- 6–7 Europe at a glance: salary map and day rate map The 21 markets on two clickable maps - permanent salary midpoints on the first, contractor day rate midpoints on the second.
- 8 Permanent salaries compared Headline permanent salary ranges for all 21 countries, ranked and converted to EUR.
- 9 Contractor day rates compared Headline contractor day rate ranges (what the contractor receives) for all 21 countries, ranked by midpoint and converted to EUR.
- 10 Europe beyond salary: cost, quality of life and tax Quality of life, cost of living, tax and deductions on €100k, ranked across the 21 markets.
- 11 What €100k gross salary leaves in your pocket Indicative take-home for a single filer on €100k, after income tax and employee contributions - all 21 markets ranked highest first.
- 12 What €100k gross salary costs the employer What employers pay on top of gross salary, ranked across all 21 markets - with the method behind the figures and how to use them.
- 13 What €1 of take-home pay costs the employer at €100k gross Gross salary plus employer on-costs for every €1 of net pay at €100k - pages 11 and 14 combined, ranked cheapest first.
- 14 What a typical SAP consultant really costs - and keeps Midpoint plus on-costs at that salary: the budget for one mid-level hire, and what they take home - ranked lowest first.
- 15 Real pay: what the midpoint is worth after tax and living costs Net midpoint adjusted for cost of living and ranked across the 21 markets - the closest thing in this guide to like-for-like pay.
- 16 Contract vs permanent: what a day rate is really worth Salary-equivalent day rate (midpoint plus on-costs over 220 days) against the contractor midpoint, with the premium ranked across the 21 markets.
- 17 Hiring timescales compared: how fast can you get someone? Eursap search, client interviews and decision, and senior notice - the weeks from search to start, ranked fastest first with joint positions.
- 18 Country deep-dives: page index The 21 country pages on one page - click a country or its flag to jump to it. One page per country: headline ranges, skill-area benchmarks, on-costs, compliance, hiring timescale and work eligibility.
- 19 What the 2026/2027 SAP market means in practice Practical takeaways for hiring managers and SAP professionals.
- 20 SAP hiring strategies Seven practical ways to close an SAP skills gap faster or at lower cost.
- 21–22 Methodology, sources and glossary How the benchmarks were built and read, plus the SAP and hiring terms used in this guide.
- 23 Get in touch Request a live, validated benchmark for your specific SAP role.
The 2026/2027 SAP market at a glance
A few numbers and useful things to know - with the pages that hold the detail.
Gross pay is not what it buys.
After tax and living costs Sweden’s €105k midpoint goes further than Switzerland’s €155k; Belgium drops 8 places and Czechia climbs 10. Compare offers on real pay and budget on cost to employer (pages 10–15).
Real pay (gold) vs gross midpoint (navy)
Scarcity: HCM & payroll, SAP Business AI, data, supply chain.
Demand is rising fastest in data, AI and HCM; architects and programme leaders with delivered S/4HANA go-lives command the highest fees. Classic ABAP alone no longer carries a premium (page 4).
Scarcity heatmap
The clock is running.
ECC mainstream maintenance ends on 31 December 2027: conversion demand peaks through 2027–2028, then the market shifts to optimisation, BTP and AI, and ECC-only skills start to discount (page 5).
ECC mainstream ends
- 2026
- 31.12.2027
- 2030
- 2033
Contract and permanent are different markets.
The day rate premium over a salary-equivalent runs from +31% (Sweden) to +115% (Romania), median +57% (Belgium); rankings differ - the UK is 8th for salaries, 12th for day rates. Price each separately (page 9 and page 16).
Contractor day rate premium over permanent salary-equivalent
Introduction
What this guide covers, who it is for, and how to use it.

What this guide covers, and who it is for
This guide sets out permanent SAP salary ranges, SAP contractor day rates, the SAP skills in demand and the hiring outlook across 21 European SAP markets for 2026/2027. It is written for hiring managers and talent teams who need a realistic view of what SAP capability costs in each country; for SAP consultants benchmarking their own salary or day rate and weighing up a raise or a move; and for leadership teams planning multi-country programmes and budgets.

One page per country
Every country has a single page: headline salary and day rate ranges, a skill-area breakdown, hiring factors, SAP hubs, contracting compliance, hiring timescales and work eligibility, with each figure ranked across all 21 countries alongside quality of life, cost of living, tax & deductions and employer on-costs.

Where the figures come from
The figures draw on Eursap’s day-to-day work placing SAP professionals across Europe - more than 175,000 SAP candidates and over 300 client relationships, live vacancies and placement data - cross-checked against public sources including Glassdoor, PayScale, SalaryExpert, StepStone, LinkedIn Jobs, Indeed, JobServe and freelancermap. Living costs and quality of life come from Numbeo; tax & deductions (page 11) and employer on-costs (page 12) from national rules and net-salary calculators; hiring context from Robert Half and Gartner. The figures are indicative benchmarks, not offers: the right number still depends on scope, language, working model and seniority.

How to read the ranges
Low indicates entry-level and junior consultants, high senior architect and management level. The midpoint is the mean of the two, not a measured median; based on Eursap’s vacancy, placement and survey data it is a reasonable approximation of a representative mid-level salary or day rate, and that is how the guide uses it. Salaries are gross annual base pay; day rates are what the contractor receives, excluding agency or other intermediary margins. Salaries are shown in € thousands (€86.25k = €86,250), day rates to the cent where not whole euros (€712.50); computed figures (take-home, costs, real pay) are rounded to the nearest €1k or €100 as shown.
What SAP professionals value most from jobs in 2026/2027
Nine factors that increasingly decide whether SAP candidates engage, stay in process and accept offers. They also apply to retaining staff.
Competitive compensation
Credible salary and rate ranges that reflect the exact skill, language and seniority required - and are met at offer stage, not low-balled or renegotiated.

Remote/hybrid work
Clear onsite expectations - days per week or a percentage - beat vague hybrid labels. Openness to remote work widens the reachable talent pool considerably.

Flexibility
Flexible hours, flexible holiday scheduling and trust in how people manage their own working day. Autonomy is valued far more than close supervision.

Role alignment
A role that fits the candidate’s real skills, seniority and career direction - not a title stretched to suit a budget. Mismatches drive early exits.

Strong & clear governance
Accessible leadership and decisive decision-making. Defined scope, clear authority and direct stakeholder access reduce the delivery risk candidates perceive.

Quick processes
Short interview loops (the best SAP profiles are gone within two weeks), quick communication lines, fast feedback and prompt decisions. Bureaucracy and inertia lose candidates.

Job stability
A financially secure client & programme, a pipeline of work beyond the current project and an employer committed to SAP long term. Security counts for more in a slower market.

Modern SAP exposure/training
Hands-on exposure to areas such as S/4HANA, BTP, Integration Suite, MDG, SAC, RAP/CAP and AI-ready data - with the training to keep pace - adds lasting career value.

Holistic wellbeing
Genuine work-life balance and support for mental wellbeing: reasonable working hours, wellness benefits, positive relationships and a healthy team environment.
Percentages show the share of SAP professionals rating each factor as essential.
SAP skills in demand in 2026/2027
Where hiring demand, talent scarcity and rate premiums concentrate across Europe - and what is driving each area.
Key SAP dates 2026–2033 and what they do to demand
The maintenance deadlines, cloud milestones and AI roadmap that shape SAP hiring - with Eursap’s read on demand and pay at each step.
-
2026
 Mid-conversion flow
Most ECC estates are mid-conversion or contracting RISE/GROW; clean core and BTP extensions are the default; Business Data Cloud and Joule pair AI with S/4 data. Geopolitical and macro-economic headwinds slow the rise in demand and pay.
Demand & pay: Architects, senior FI/CO, BTP/integration at peak; EWM/TM and data scarce.
Demand ▲ Pay ▲ -
31 Dec 2027
 ECC mainstream maintenance ends
End of mainstream maintenance for ECC 6.0 (EHP 6–8) and Business Suite 7. Many late movers compress timelines and lean on partners and contractors.
Demand & pay: Second spike in conversion, testing and cutover roles; brownfield and data-migration premiums peak.
Demand ▲▲▲ Pay ▲▲ -
2028
 Extended maintenance (+2%) begins
Laggards pay for extended maintenance to end-2030 or take the RISE transition option, which keeps ECC supported to 2033 for customers committed to RISE.
Demand & pay: Hypercare, integration and data teams stay busy; ECC-only functional skills start to discount.
Demand ▲▲ Pay ▲▲ -
2029
 Optimise and automate
Live S/4 estates move budget to process mining, analytics, Joule agents and side-by-side apps on BTP; public-cloud (GROW) adoption widens in the mid-market.
Demand & pay: BTP, data/MDG and AI-adjacent profiles overtake conversion roles; classic ABAP pay softens; AI use starts to affect demand and pay.
Demand ▲ Pay ► -
31 Dec 2030
 ECC extended maintenance ends
Final deadline for customers outside RISE: last-wave conversions, carve-outs and decommissioning of legacy landscapes.
Demand & pay: A short, intense migration burst, then conversion roles taper; architecture, AI and analytics dominate.
Demand ▲▲ Pay ▲ -
2033
 End of the ECC era
RISE transition-option support for ECC ends; the installed base is S/4HANA and cloud ERP, with agentic AI standard in cloud editions.
Demand & pay: Cloud-edition, clean-core and AI skills set the premium; legacy ECC skills become a niche.
Demand ▲ Pay ►
Europe at a glance: where permanent SAP jobs pay most
Permanent salary midpoint for a typical mid-level SAP consultant, in EUR, across the 21 markets Eursap covers.
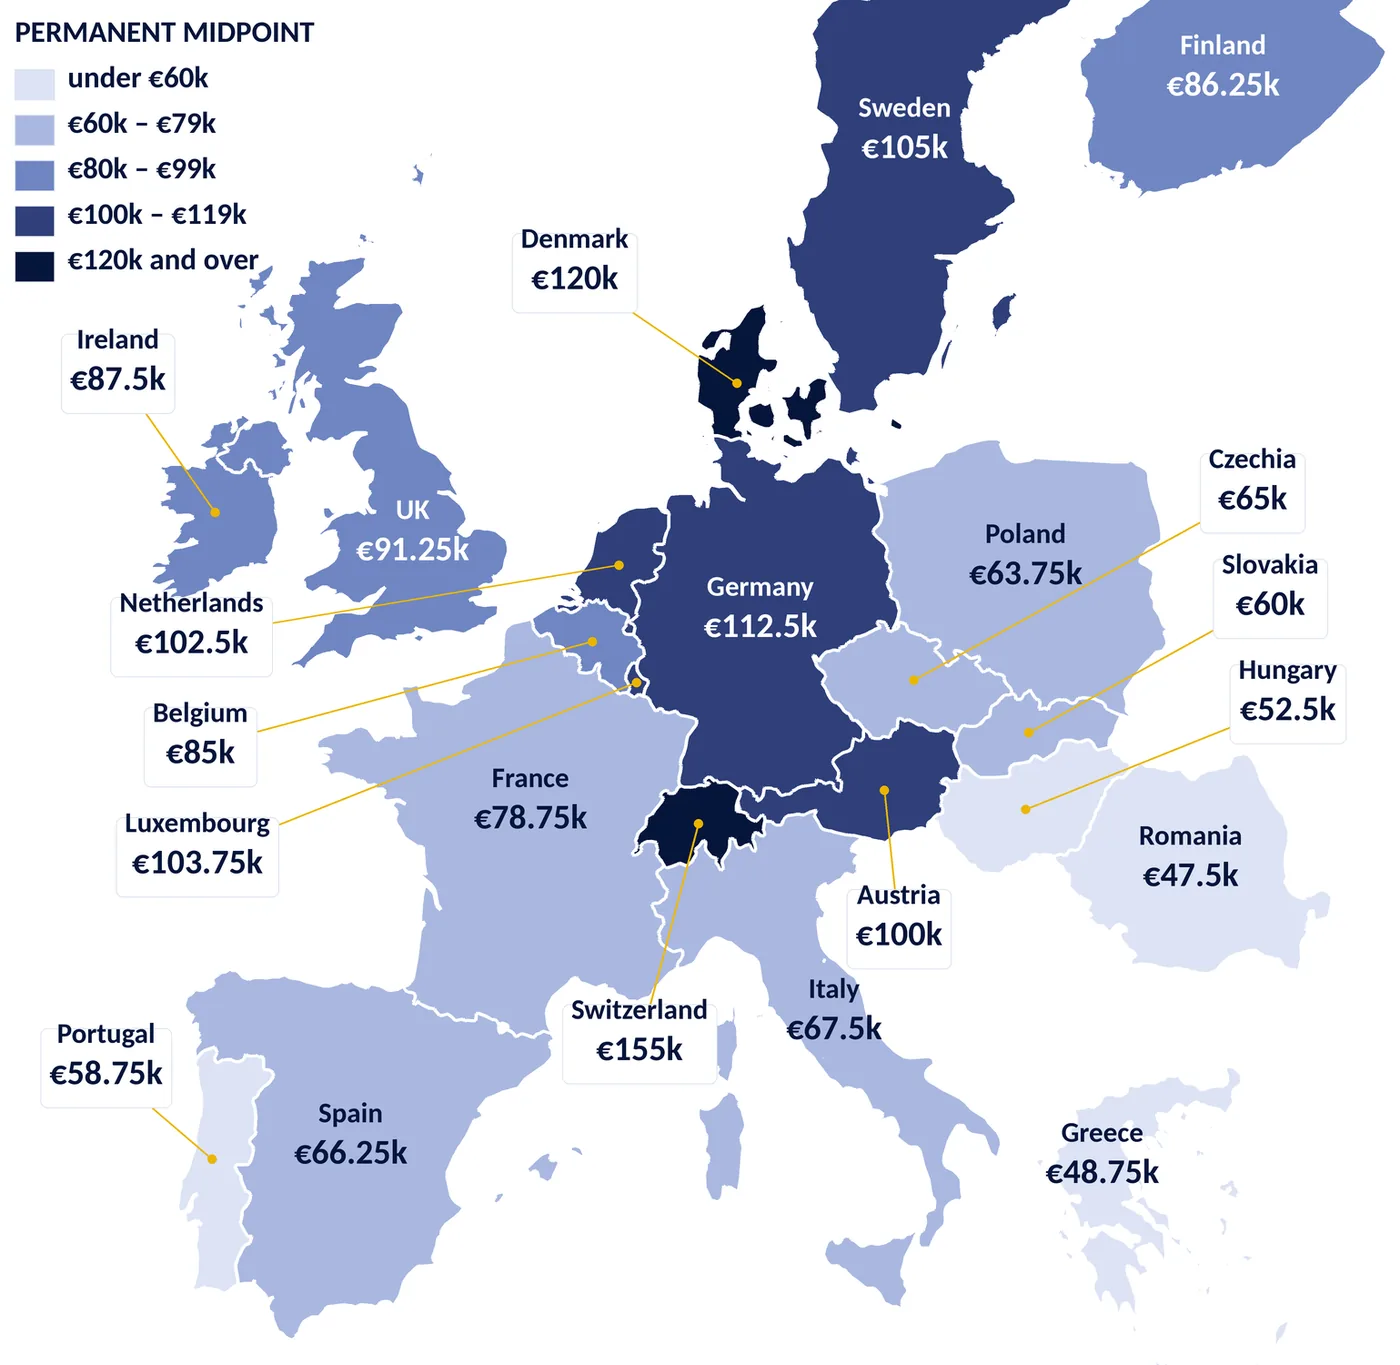
RANKED BY PERMANENT MIDPOINT
-
1
 Switzerland
€155k
-
2
 Denmark
€120k
-
3
 Germany
€112.5k
-
4
 Sweden
€105k
-
5
 Luxembourg
€103.75k
-
6
 Netherlands
€102.5k
-
7
 Austria
€100k
-
8
 United Kingdom
€91.25k
-
9
 Ireland
€87.5k
-
10
 Finland
€86.25k
-
11
 Belgium
€85k
-
12
 France
€78.75k
-
13
 Italy
€67.5k
-
14
 Spain
€66.25k
-
15
 Czechia
€65k
-
16
 Poland
€63.75k
-
17
 Slovakia
€60k
-
18
 Portugal
€58.75k
-
19
 Hungary
€52.5k
-
20
 Greece
€48.75k
-
21
 Romania
€47.5k
Europe at a glance: where SAP contract assignments pay most
Contractor day rate midpoint for a typical mid-level SAP consultant, in EUR, across the 21 markets Eursap covers.
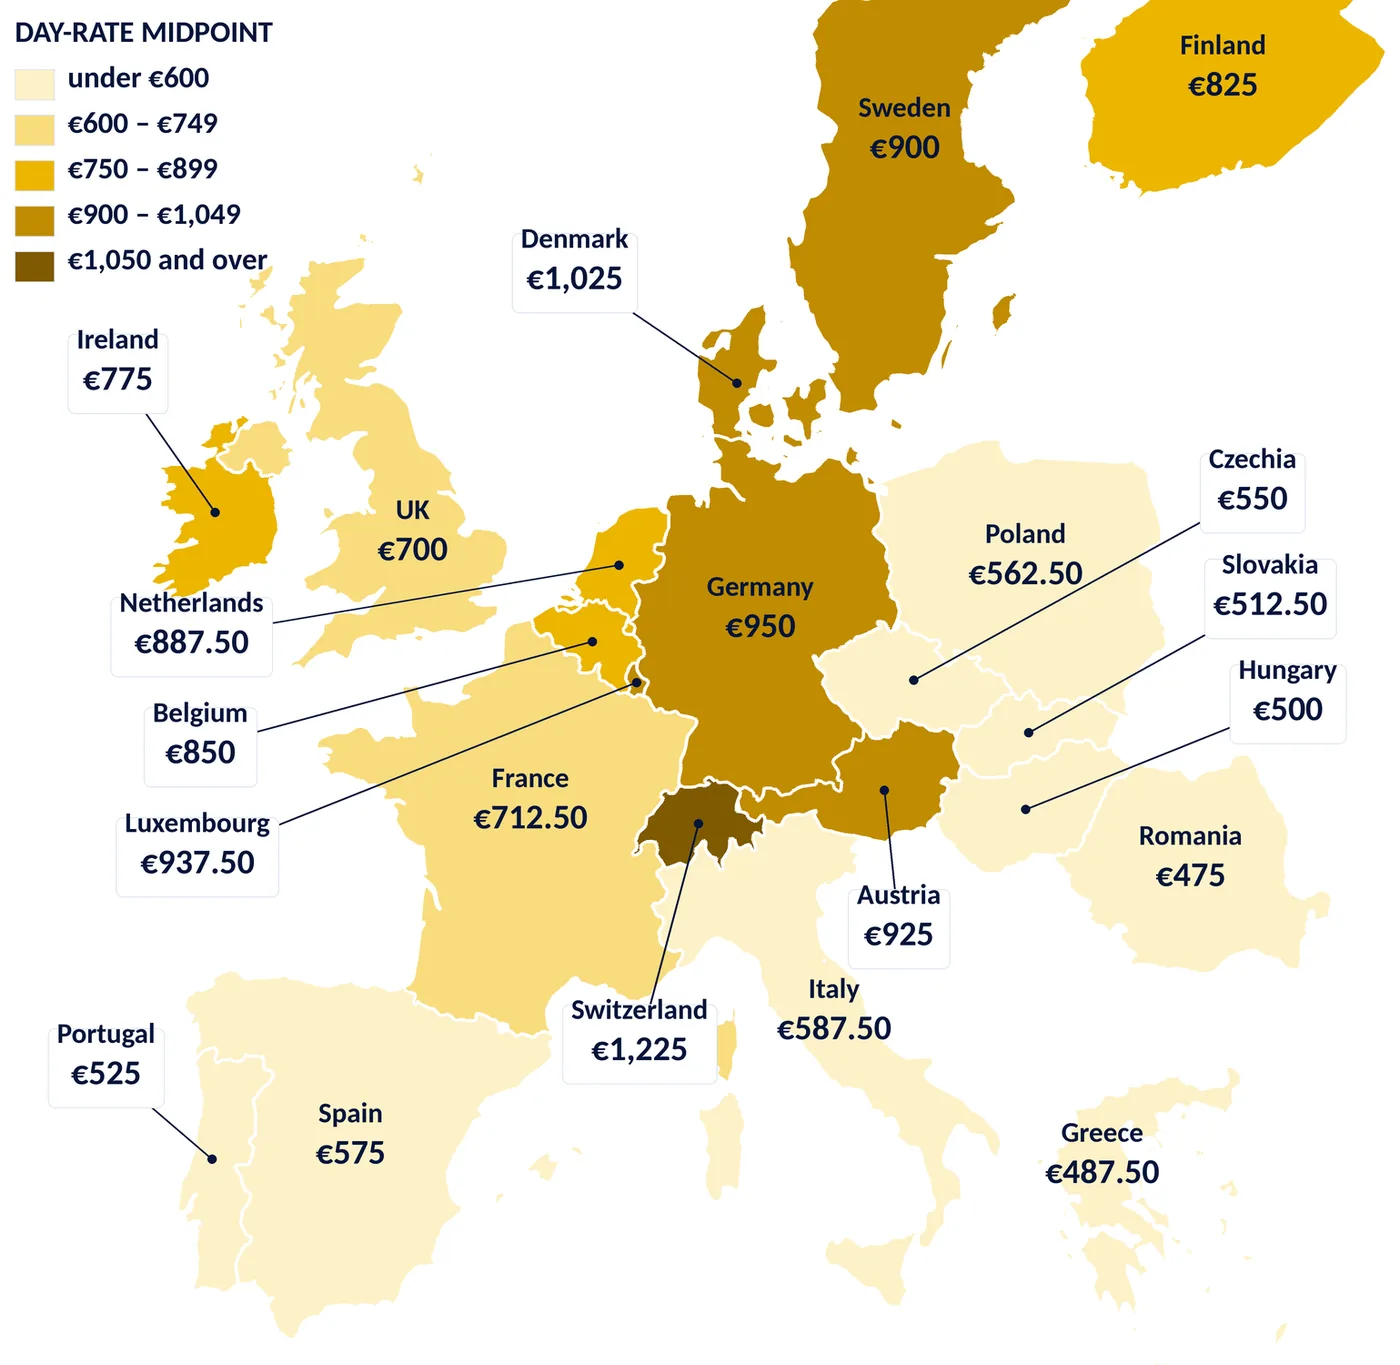
RANKED BY DAY-RATE MIDPOINT
-
1
Switzerland
€1,225
-
2
Denmark
€1,025
-
3
Germany
€950
-
4
Luxembourg
€937.50
-
5
Austria
€925
-
6
Sweden
€900
-
7
Netherlands
€887.50
-
8
Belgium
€850
-
9
Finland
€825
-
10
Ireland
€775
-
11
France
€712.50
-
12
United Kingdom
€700
-
13
Italy
€587.50
-
14
Spain
€575
-
15
Poland
€562.50
-
16
Czechia
€550
-
17
Portugal
€525
-
18
Slovakia
€512.50
-
19
Hungary
€500
-
20
Greece
€487.50
-
21
Romania
€475
Permanent salaries compared
SAP salary range from junior to senior, with the midpoint for a typical mid-level consultant, converted to EUR for cross-market comparison.
Ranked by midpoint. Bars run from the headline low to high across all skill areas on the country page; the navy section ends at the midpoint: mean of low and high, a proxy for a mid-level consultant (page 21).
Contractor day rates compared
Day rates paid to the contractor (no agency or intermediary margin), junior to senior, with the midpoint for a mid-level consultant.
Ranked by midpoint. Bars run from the headline low to high across all skill areas on the country page; the navy section ends at the midpoint: mean of low and high, a proxy for a mid-level consultant (page 21).
Europe beyond salary: cost, quality of life & tax
Three country-context indicators for interpreting compensation across markets.
Quality of Life Index (higher is better)
-
Netherlands · 1st
-
Denmark · 2nd
-
Luxembourg · 3rd
-
Switzerland · 4th
-
Finland · 5th
-
Austria · 6th
-
Germany · 7th
-
Sweden · 8th
-
Spain · 9th
-
United Kingdom · 10th
-
Czechia · 11th
-
Belgium · 12th
-
France · 13th
-
Portugal · 14th
-
Ireland · 15th
-
Slovakia · 16th
-
Poland · 17th
-
Italy · 18th
-
Hungary · 19th
-
Romania · 20th
-
Greece · 21st
Cost of Living Index (lower is better)
-
Romania · 1st
-
Poland · 2nd
-
Slovakia · 3rd
-
Portugal · 4th
-
Hungary · 5th
-
Spain · 6th
-
Czechia · 7th
-
Greece · 8th
-
Italy · 9th
-
Sweden · 10th
-
France · 11th
-
Germany · 12th
-
United Kingdom · 13th
-
Belgium · 14th
-
Finland · 15th
-
Austria · 16th
-
Ireland · 16th
-
Netherlands · 18th
-
Denmark · 19th
-
Luxembourg · 19th
-
Switzerland · 21st
Tax & deductions on €100k (lower is better)
-
Switzerland · 1st
-
Czechia · 1st
-
United Kingdom · 3rd
-
Hungary · 4th
-
Spain · 5th
-
Slovakia · 5th
-
Sweden · 5th
-
Ireland · 8th
-
Luxembourg · 8th
-
Denmark · 10th
-
Netherlands · 10th
-
Finland · 12th
-
France · 12th
-
Austria · 12th
-
Poland · 15th
-
Romania · 16th
-
Germany · 16th
-
Greece · 16th
-
Portugal · 19th
-
Italy · 20th
-
Belgium · 21st
Tax & deductions = approximate income tax plus statutory employee deductions (social security, health, pension) on €100k for a single filer, standard deductions, no expat regimes; Switzerland is a nine-canton average - method and sources on page 11. Indices are Numbeo scores.
What €100k gross salary leaves in your pocket
Approximate take-home on €100k for a single filer after tax & statutory deductions (income tax, social security) - all 21 markets ranked.
NET TAKE-HOME ON €100k GROSS · RANK 1 = MOST LEFT IN YOUR POCKET
What €100k gross salary costs the employer
Statutory employer contributions and levies on top of gross salary, ranked across all 21 markets - and what they mean for a hiring budget.
EMPLOYER ON-COSTS ON €100k GROSS · RANK 1 = LOWEST COST TO EMPLOY
ON-COST
EMPLOYER
Romania
+2.25%*
€102k
2
Denmark
+12%
€112k
3
Ireland
+12.6%
€113k
4
Hungary
+13%
€113k
5
Luxembourg
+14%
€114k
6
Switzerland
+15%
€115k
7
United Kingdom
+16%
€116k
8
Poland
+16.7%
€117k
9
Spain
+18.5%
€119k
10
Germany
+19%
€119k
11
Finland
+21%
€121k
12
Greece
+21.5%
€122k
13
Netherlands
+24%
€124k
14
Portugal
+24.8%
€125k
15
Austria
+29.5%
€130k
16
Czechia
+31.8%
€132k
17
Slovakia
+36.2%
€136k
18
Italy
+37%
€137k
19
Belgium
+40%
€140k
20
Sweden
+43%
€143k
21
France
+45%
€145k
 WHAT EMPLOYER ON-COSTS ARE
The statutory charges an employer pays on top of gross salary: employer social security (pension, health, unemployment, accident cover), payroll levies and compulsory pay elements such as holiday pay or a 13th month. They never show on the employee’s payslip, but they are real cash cost - from 2.25% of gross in Romania to 45% in France.
 HOW WE CALCULATED THEM
Modelled on a €100k gross salary (or local equivalent) at 2026 employer contribution rates with ceilings applied - capped markets (Germany, Spain, Poland, Czechia) show a lower effective rate than their headline rates. Employer pensions included where effectively mandatory (Denmark, Sweden, UK); bonuses, benefits and fees excluded.
 HOW TO USE THE NUMBER
Cost to employer ≈ gross × (1 + on-cost): the same €100k salary costs about €102k in Romania and €145k in France. Treat a low on-cost with care: Romania* moved social contributions from employer to employee in 2018 - still paid via the employer, just not counted here. Page 13 and page 14 add employee tax and contributions back.
What €1 of take-home pay costs the employer at €100k gross
Gross salary plus on-costs for every €1 of net pay at €100k gross - page 11 and page 12 combined, all 21 markets ranked cheapest first.
EMPLOYER COST PER €1 OF NET PAY, AT €100k GROSS · RANK 1 = CHEAPEST
€1 NET
TAX & CONTRIBUTIONS
ON-COSTS
Switzerland
€1.58
€0.37
€0.21
2
United Kingdom
€1.65
€0.42
€0.23
3
Hungary
€1.70
€0.50
€0.20
4
Ireland
€1.75
€0.55
€0.20
5
Romania
€1.75
€0.71
€0.04
6
Luxembourg
€1.78
€0.56
€0.22
7
Denmark
€1.78
€0.59
€0.19
8
Czechia
€1.81
€0.38
€0.44
9
Spain
€1.82
€0.53
€0.28
10
Poland
€1.94
€0.66
€0.28
11
Finland
€1.94
€0.61
€0.34
12
Netherlands
€1.98
€0.59
€0.38
13
Germany
€2.05
€0.72
€0.33
14
Slovakia
€2.09
€0.54
€0.56
15
Austria
€2.11
€0.63
€0.48
16
Greece
€2.11
€0.74
€0.37
17
Portugal
€2.18
€0.75
€0.43
18
Sweden
€2.20
€0.54
€0.66
19
France
€2.35
€0.62
€0.73
20
Italy
€2.48
€0.81
€0.67
21
Belgium
€2.61
€0.86
€0.74
WHAT IT SHOWS
Page 11 and page 12 combined: everything the employer pays - gross salary plus statutory on-costs - for each €1 that reaches the employee, at €100k gross. One number that compares a Swiss, a German and a Romanian hire like for like, and it reorders both of the tables before it.
HOW WE CALCULATED IT
Cost per €1 net = (1 + employer on-cost, page 12) ÷ net share of gross (page 11). Exact at €100k gross; above that the ratio creeps up in progressive systems, so budget a little more for a €150k hire everywhere except flat-tax Romania and Hungary. For a real hire, recalculate both at the actual salary - page 14 does this at each market’s midpoint.
HOW TO USE IT
Romania has the lowest on-costs (+2.25%) yet sits 5th here: 42% of gross goes in employee tax and contributions, so €100k net needs about €171k gross and €175k cost to employer. Where the wedge is wide (Belgium, Italy, France) a net-pay promise is costly - quote gross. Where it is narrow (Switzerland, UK, Hungary) a higher gross costs less than it looks.
What a typical SAP consultant really costs - and keeps
Midpoint salary plus on-costs - what one mid-level hire costs in each market, and what they keep (page 8, page 11 and page 12 combined).
COST TO EMPLOYER OF A MID-LEVEL SAP CONSULTANT, EUR PER YEAR · RANK 1 = LOWEST
EMPLOYER
SALARY
KEEPS (NET)
Romania
€49k
€47.5k
€28k
2
Greece
€59k
€48.75k
€32k
3
Hungary
€59k
€52.5k
€35k
4
Portugal
€73k
€58.75k
€37k
5
Poland
€78k
€63.75k
€39k
6
Slovakia
€82k
€60k
€41k
7
Spain
€85k
€66.25k
€46k
8
Czechia
€86k
€65k
€49k
9
Italy
€92k
€67.5k
€40k
10
Ireland
€99k
€87.5k
€59k
11
Finland
€104k
€86.25k
€55k
12
United Kingdom
€106k
€91.25k
€65k
13
France
€114k
€78.75k
€50k
14
Luxembourg
€118k
€103.75k
€66k
15
Belgium
€119k
€85k
€48k
16
Netherlands
€127k
€102.5k
€64k
17
Austria
€130k
€100k
€62k
18
Germany
€132k
€112.5k
€65k
19
Denmark
€134k
€120k
€73k
20
Sweden
€151k
€105k
€67k
21
Switzerland
€175k
€155k
€113k
WHAT IT SHOWS
The budget for one mid-level SAP consultant in each market: the permanent midpoint from page 8 plus the employer on-costs from page 12, split into what the consultant keeps, employee tax and contributions, and the employer’s own contributions. Page 13 shows the ratio; this page shows the money.
HOW WE CALCULATED IT
Cost to employer = midpoint × (1 + employer on-cost at that salary); take-home = midpoint after income tax and contributions. Both use the page 11 and page 12 rates at each midpoint: a €48.75k Greek midpoint keeps more than €100k would, a €155k Swiss one a little less; capped systems (Germany, Spain, Poland, Czechia) cost less above the ceiling.
HOW TO USE IT
Nearshoring: a German midpoint hire costs about €132k a year, a Polish one €78k - €54k saved per head, though the Polish consultant keeps €39k vs €65k in Germany. Salary rank is not cost rank: Belgium €119k, France €114k cost more than their gross suggests; Luxembourg €118k, Ireland €99k less. Across 21 markets the same role spans 3.6×.
Real pay: what the midpoint is worth after tax and living costs
Permanent midpoint, net of tax & deductions, then adjusted to the 21-market average cost of living - the closest thing to like-for-like pay.
REAL PAY · NET MIDPOINT ADJUSTED FOR COST OF LIVING · RANK 1 = GOES FURTHEST
MIDPOINT
TAX
PAY
GROSS RANK
Sweden
€105k
€67.4k
€65.5k
▲3
2
Switzerland
€155k
€112.7k
€65.4k
▼1
3
United Kingdom
€91.25k
€65.2k
€60.9k
▲5
4
Germany
€112.5k
€64.6k
€60.5k
▼1
5
Czechia
€65k
€49k
€60k
▲10
6
Denmark
€120k
€72.8k
€59k
▼4
7
Spain
€66.25k
€46k
€57.1k
▲7
8
Netherlands
€102.5k
€63.8k
€55.7k
▼2
9
Austria
€100k
€61.5k
€55.3k
▼2
10
Poland
€63.75k
€39.2k
€54.1k
▲6
11
Slovakia
€60k
€41.2k
€54.1k
▲6
12
Luxembourg
€103.75k
€66.1k
€53.6k
▼7
13
Ireland
€87.5k
€58.5k
€52.7k
▼4
14
Finland
€86.25k
€55.3k
€51.4k
▼4
15
Portugal
€58.75k
€37.2k
€48.7k
▲3
16
France
€78.75k
€50k
€47.6k
▼4
17
Romania
€47.5k
€27.8k
€44.8k
▲4
18
Hungary
€52.5k
€34.9k
€44.7k
▲1
19
Belgium
€85k
€47.5k
€44.3k
▼8
20
Italy
€67.5k
€39.9k
€41.4k
▼7
21
Greece
€48.75k
€32.3k
€38.6k
▼1
WHAT REAL PAY IS
The permanent midpoint - a proxy for a typical mid-level consultant’s pay - after the effective tax & deductions of that market, then re-based to what the money buys: a market whose cost of living is 10% above the 21-country average has its net pay reduced by 10%, and vice versa. The closest single number to like-for-like pay across Europe.
HOW WE CALCULATED IT
Real pay = net midpoint ÷ (Numbeo cost-of-living index, page 10 ÷ 21-market average of 64). Net = midpoint after 2026 income tax and contributions at that salary - the page 11 rates with each market’s bands and ceilings, so a €48.75k midpoint keeps more than €100k would and a €155k one a little less. Figures in “average-market euros”.
HOW TO USE IT
Candidates: a lower gross offer can leave you better off - compare the real-pay rank, not the headline. Hiring managers: this is why nearshore and Nordic markets attract relocators and why gross-only benchmarks mislead - a €105k Swedish midpoint goes further than €155k in Switzerland after tax and living costs.
Contract vs permanent: what a day rate is really worth
The contractor day rate midpoint in each market, against the permanent midpoint plus employer on-costs, spread over 220 working days.
CONTRACTOR MIDPOINT VS SALARY-EQUIVALENT DAY RATE · RANK 1 = LARGEST PREMIUM
Romania
2
Hungary
3
Greece
4
Luxembourg
5
Finland
6
Ireland
7
Denmark
8
Germany
9
Poland
10
Portugal
11
Belgium
12
Austria
13
Netherlands
14
Switzerland
15
Spain
16
United Kingdom
17
Czechia
18
Italy
19
Slovakia
20
France
21
Sweden
WHAT IT SHOWS
The salary-equivalent day rate is what a permanent hire at the midpoint costs the employer per working day with statutory on-costs added and the year spread over 220 days. The premium is how much more the contractor’s own rate is than that - before any agency margin - the price of flexibility, speed and no long-term commitment.
HOW WE CALCULATED IT
Salary-equivalent day rate = permanent midpoint × (1 + employer on-cost at that salary: the page 12 rate with ceilings applied) ÷ 220. Premium = contractor midpoint (page 9) ÷ salary-equivalent − 1. Both midpoints are the mean of the headline low and high; non-euro markets at the guide’s reference rates.
HOW TO USE IT
A contract premium of roughly 45–75% is normal: contractors fund their own leave, pension, insurance and bench time. Above that (Romania, Hungary, Greece) day rates follow international programme budgets, not local pay, so permanent hires are relatively cheap; below it (Czechia, Italy, Slovakia, France, Sweden) high on-costs make contracting good value.
Hiring timescales compared: how fast can you get someone?
Eursap’s search, the client’s interviews and decision, and the notice a senior SAP professional serves - weeks from search to first day.
WEEKS FROM SEARCH TO START, PERMANENT HIRE · RANK 1 = FASTEST · = JOINT
SEARCH
DECISION
PERIOD
TO FILL
Finland
1–2 wks
3–4 wks
2–4 wks
≈8 wks
1=
Spain
1–2 wks
3–4 wks
2–4 wks
≈8 wks
1=
Denmark
1–2 wks
2–3 wks
4 wks
≈8 wks
1=
Hungary
1–2 wks
2–3 wks
4 wks
≈8 wks
5=
Greece
1–2 wks
3–4 wks
2–6 wks
≈9 wks
5=
Netherlands
1–2 wks
3–4 wks
4 wks
≈9 wks
7=
Romania
1–2 wks
2–3 wks
4–9 wks
≈10 wks
7=
Slovakia
1–2 wks
2–3 wks
4–9 wks
≈10 wks
9
Portugal
1–2 wks
3–4 wks
4–9 wks
≈11 wks
10=
Czechia
1–2 wks
2–3 wks
9 wks
≈13 wks
10=
Poland
1–2 wks
2–3 wks
4–13 wks
≈13 wks
10=
United Kingdom
1–2 wks
2–3 wks
4–13 wks
≈13 wks
13=
Austria
1–2 wks
3–4 wks
4–13 wks
≈14 wks
13=
Belgium
1–2 wks
3–4 wks
4–13 wks
≈14 wks
13=
Ireland
1–2 wks
3–4 wks
4–13 wks
≈14 wks
13=
Luxembourg
1–2 wks
3–4 wks
4–13 wks
≈14 wks
17=
France
1–2 wks
4–5 wks
4–13 wks
≈15 wks
17=
Italy
1–2 wks
4–5 wks
4–13 wks
≈15 wks
17=
Sweden
1–2 wks
4–5 wks
4–13 wks
≈15 wks
17=
Switzerland
1–2 wks
4–5 wks
4–13 wks
≈15 wks
17=
Germany
1–2 wks
4–6 wks
4–13 wks
≈15 wks
WHAT IT SHOWS
Weeks from launching a permanent search to the new hire’s first day, in three stages that add up: Eursap’s search (one to two weeks to a shortlist), the client’s interviews and decision, then the notice a senior SAP professional usually has to serve. Contractors skip most of the notice - one to three weeks to an offer and a start within days of signature.
HOW TO READ IT
The columns add up to the total. Interviews & decision = the country page’s time to offer less Eursap’s search, assuming a ready process (agreed range, named decision-makers, interview slots held). Notice = typical senior range in weeks, bar at the midpoint; the country pages carry statutory minimums, probation and tenure rules.
HOW TO USE IT
Start a permanent search three to four months ahead in Germany, Switzerland, Sweden, Italy and France (in Germany add two to four weeks for works-council consent); two to three months elsewhere; with a month’s notice or less (Finland, Spain, Denmark, Hungary, Netherlands) a hire can start in about two months. Sooner? Contract or EOR (page 20).
Country deep-dives: page index
21 European SAP markets, one page each. Click a country or its flag to go straight to that page.
-
Austria
-
Belgium
-
Czechia
-
Denmark
-
Finland
-
France
-
Germany
-
Greece
-
Hungary
-
Ireland
-
Italy
-
Luxembourg
-
Netherlands
-
Poland
-
Portugal
-
Romania
-
Slovakia
-
Spain
-
Sweden
-
Switzerland
-
United Kingdom
Each country page: headline ranges and midpoints, a skill-area table, SAP hubs, hiring factors, on-costs, contracting compliance, work eligibility and hiring timescales.
What the 2026/2027 SAP market means in practice
Five takeaways for each side of the hiring table.
FOR HIRING MANAGERS 
-
1
Benchmark by market, not by region. Permanent midpoints span 3.3× (Switzerland €155k, Romania €47.5k), day rates 2.6× and on-costs 2.25–45% - so price the exact skill, language, location and working model, not a region.
-
2
Permanent and contract rankings differ. The UK is 8th for permanent pay but 12th for day rates; Belgium is 11th and 8th. Build a separate case for each engagement model rather than converting one from the other.
-
3
Candidates weigh what an offer buys. Cost of living runs from index 40 (Romania) to 110 (Switzerland) and effective tax & deductions on €100k from 27% to 46% - sell the whole package, not just the headline figure.
-
4
Speed and clarity win scarce profiles. Agree the range, contract status and hybrid rhythm before launch, name the decision-makers, hold interview slots and offer within two weeks of first interview.
-
5
Sell the programme and close the loop. S/4HANA, BTP or transformation scope pulls harder than a generic ‘SAP role’ - and every candidate should get a decision and a reason; in a small market that protects your brand.
FOR SAP PROFESSIONALS 
-
1
Compound modern delivery experience. S/4HANA, BTP and Integration Suite, clean core, data governance and MDG, analytics, architecture and programme ownership are the skills that keep commanding attention.
-
2
Know your number by market and skill area. Use the country pages: each headline range spans every skill area, with architecture and programme leadership at the top and the midpoint approximating a mid-level consultant.
-
3
Compare offers on purchasing power. Switzerland’s cost of living is 2.8× Romania’s and tax & deductions run from 27% to 46%, so the real-pay ranking (page 15) reorders the table: Sweden tops it and Belgium drops eight places.
-
4
Contracting pays most where programmes are largest. Headline contractor midpoints reach €800/day or more in 9 of 21 markets, led by Switzerland, Denmark and Germany at roughly €950 – €1,225/day.
-
5
Languages and flexibility widen your options. German, French, Dutch or a Nordic language alongside English opens the best-paying markets, and openness to hybrid working puts far more roles within reach.
SAP hiring strategies
Seven practical ways to close an SAP skills gap faster, or at lower cost, when the obvious hire is not available.
 1
Offshoring & nearshoring
Base delivery in Poland, Czechia, Romania or Portugal: permanent midpoints run at 40–60% of German levels for the same S/4 skills, in EU time zones.
 2
Employer of Record (EOR) hiring
Hire in any of the 21 markets without a local entity - the EOR employs the consultant compliantly while you direct the work, live in weeks rather than months.
 3
Remote-first, onsite for milestones
Design roles remote-first with agreed onsite blocks for design workshops, testing and cutover - it opens a whole country’s talent pool, not one commute.
 4
Part-time & fractional hires
Senior MDG, IBP, security or architecture skills are often needed two or three days a week - a fractional hire secures them at a fraction of a full-time cost.
 5
B2B contracts instead of permanent
In Poland, Czechia, Romania, Hungary and the Netherlands many seniors prefer a B2B contract to employment - offering it widens the shortlist and cuts notice periods.
 6
Language training
Where German, French or Dutch is the blocker, hire the strongest SAP profile and fund intensive language tuition - B1 to B2 is faster than finding a perfect bilingual.
 7
Upskill graduates
Pair IT graduates or junior developers with senior leads on ABAP Cloud, BTP and analytics: 12–18 months builds a loyal bench at entry-level cost while seniors stay scarce.
HOW EURSAP CAN HELP
Want to hear more about these and other creative hiring solutions?
Talk it through with us - we offer consultative hiring solutions and can benchmark pay for your role and location.
Book a meeting →Methodology & sources
How the benchmarks were built, what they draw on, and how to read them.
 Scope & benchmarks
21 European SAP markets. Permanent figures are gross annual base salaries; contractor figures are the day rate the contractor receives - agency, umbrella and other intermediary margins (an SI’s fee, say) are not included. Both in EUR, local currency in brackets for non-euro markets. Ranges vary by module, seniority, industry, language and working model.
 Eursap market data
Our own European SAP candidate network, live vacancies, placement data and recruitment analysis - the primary evidence behind every range in this guide.
 Public cross-checks
Spot-checks against Glassdoor, PayScale, SalaryExpert, StepStone, LinkedIn Jobs, Indeed, JobServe and freelancermap, plus Eurostat, European Commission, OECD and national labour statistics where relevant.
 Currency comparison
Local currencies converted to EUR at xe.com mid-market rates (15 October 2026): CHF 0.931, DKK 7.48, SEK 11.18, GBP 0.846, PLN 4.37, CZK 24.36, HUF 364, RON 5.34 per euro. A ±5% FX move shifts a non-euro market by up to three EUR ranks - most for Sweden (4th–7th on both salaries and day rates).
 Living costs, tax & take-home
Numbeo quality-of-life and cost-of-living indices; tax & take-home on €100k from salaryaftertax.com, talent.com and Eursap calculations on 2026 rules (pages 10–11); pages 14–16 recompute tax and on-costs at each market’s midpoint.
 Rules & interpretation
Employer on-costs, contracting compliance, notice/probation and work-eligibility notes summarise national social-security, labour and immigration rules - indicative, not legal or tax advice. Validate the role before hiring. Hiring timescales (page 17): time to offer from Eursap placement data; notice is the typical range, cross-checked against statutory rules.
How to read the ranges: low indicates entry-level and junior consultants, high senior architect and management level. The midpoint is the mean of the two - the arithmetic centre of a range that runs from junior to senior architect, not a measured median. Based on Eursap’s vacancy, placement and survey data it is a reasonable approximation of a representative mid-level salary or day rate, and the guide uses it that way. Skill-area breakdowns on the country pages apply Eursap’s cross-market skill premia to each country’s headline range, so rows are comparable across markets.
How to cite this guide: Eursap, European SAP Salary & Rate Guide 2026/2027 (October 2026), eursap.eu.
Glossary
The SAP and hiring terms used in this guide, in plain English.
SAP PRODUCTS, PROGRAMMES & PROJECT TERMS
- ECC
- SAP ERP Central Component, the classic SAP ERP. Mainstream maintenance ends 31 Dec 2027; extended maintenance to 2030, RISE transition option to 2033.
- S/4HANA
- SAP’s current ERP suite - on-premise, private cloud (RISE) or public cloud (GROW).
- RISE / GROW with SAP
- SAP’s bundled routes to S/4HANA Cloud: RISE (private edition, existing customers) and GROW (public edition, new and mid-market).
- Brownfield / greenfield
- Converting an existing ECC system in place vs a fresh S/4HANA build.
- Clean core
- Keeping the ERP core standard, with extensions built on BTP.
- BTP
- SAP Business Technology Platform - integration (Integration Suite/CPI), extensions (ABAP Cloud), data and AI.
- ABAP / ABAP Cloud
- SAP’s programming language; ABAP Cloud is the clean-core-compliant version.
- Fiori
- SAP’s user-interface framework for S/4HANA.
- Joule
- SAP’s generative-AI assistant and agents across SAP applications.
- Business Data Cloud
- SAP’s data platform, with Datasphere (data fabric) and SAP Analytics Cloud (SAC), feeding analytics and AI with S/4HANA data.
- MDG
- Master Data Governance - clean, consistent master data.
- EWM / TM / IBP
- Supply-chain applications: warehousing, transportation and planning.
- GRC / IAG
- Governance, Risk & Compliance; Identity Access Governance (security).
- SuccessFactors / ECP
- SAP’s cloud HR suite; ECP is its payroll engine.
- Cutover / hypercare
- The go-live switch, and the intensive support period that follows it.
HIRING, CONTRACTING & PAY TERMS
- Low / midpoint / high
- Junior (low) to senior architect and management (high); the midpoint is the mean of the two, used as a reasonable approximation of a representative mid-level salary or rate (page 21).
- Day rate
- The daily rate the contractor receives, excluding VAT and any agency or intermediary margin; no paid leave, pension or benefits.
- Effective tax & deductions
- Income tax plus employee contributions as a share of gross (pages 10–11).
- Employer on-costs
- Statutory employer contributions and levies on top of gross salary (page 12).
- Cost per €1 of net pay
- Gross plus on-costs per €1 the employee keeps, at €100k gross (page 13).
- Cost to employer
- Gross salary plus the employer on-costs due on it (page 14).
- Real pay
- The net midpoint adjusted to the 21-market average cost of living (page 15).
- Contract premium
- How far the contractor midpoint exceeds the salary-equivalent (page 16).
- EOR
- Employer of Record - employs staff locally where you have no entity.
- B2B contract
- A contractor engaged via their own company (Polish B2B, Dutch zzp, UK PSC).
- IR35
- UK off-payroll rules that decide whether a contractor is taxed like an employee (inside) or not (outside).
- Umbrella / PAYE
- A UK contractor employed via an umbrella company, taxed at source.
- EU Blue Card
- EU work and residence permit for non-EU professionals above a national salary threshold.
- Expat tax regime
- Reduced-tax schemes for incoming professionals, e.g. the Dutch 30% ruling or Spain’s Beckham law.
- Notice / probation
- The notice period and probation length that govern how quickly someone can start or leave.
It’s good to talk.
Real people, real SAP market knowledge.
Whether you’re hiring SAP talent or weighing up your next SAP role, our team would be delighted to help - market by market, in your language, with figures we can stand behind.
300+ European clients • 175,000+ SAP professionals • 21 countries
 Daniel Patel
 Dean Malik
 Tony Young
 Tony White
 Matthew Shaw
 Suman Sandhu
SAP EMPLOYERS / HIRING MANAGERS
Need to hire SAP talent? Book a short intro meeting/call. We’ll validate the salary or day rate, show you the realistic market and agree next steps. Feel free to also browse some of our featured available SAP Talent.
 Book a meeting
 Browse SAP Talent
SAP PROFESSIONALS
Looking for your next SAP role? Register your CV with us and browse our latest SAP Job Vacancies - every application gets a reply.
 Register your CV
 Browse SAP Jobs
Eursap Ltd • info@eursap.eu • UK: +44 (0) 203 1500 318 • NL: +31 (0) 20 890 8064